Ruslan's GSoC Final Report
TL;DR - GSoC Summary
Student: Ruslan Yermakov
Mentor: Dr Kirstie Whitaker
Organization: INCF
Project: Open-source project scona - a toolkit to perform brain network analyses
Project’s goal: Producing publication-ready brain network analysis results and visualisations from the command line
In this blog I am sharing the achieved deliverables and results with the community.
The scope of the project
The brain made up of many regions that communicate millions of messages every second.
Traditional neuroimaging analyses have considered each region separately and therefore failed to capture many aspects of brain structure and function.
The scona project provides open source, documented, tested and modular code to investigate structural covariance in the brain as a network.
These analyses are reproducible, transparent and accessible to new and expert brain imaging researchers and network neuroscientists.
Within the GSoC program I was able to achieve the following deliverables:
- Development of the command line tool that allows users to complete an entire neuroimaging analysis from start to finish;
- Implementation of visualisation module to plot MRI data and the results of structural covariance brain network analyses;
- Improvement of the visualisation results and output reports at the end of the analysis, as a result the final visualisations are ready for publication in a scientific journal;
- Well-written documentation and clear tutorials to help users better understand how to use the package and its functionalities;
- Bugs-fixing and solving issues in the project.
Links to my contributions
There are a bunch of issues within the project, which were used to discuss new features, to find solutions for challenges and to communicate the results. You can easily search for issues by filtering using label “visualisations” and/or “enhancement”.
Here are the links to my merged Pull Requests that cover all the work:
- Implementation of visualisation tools #121
- Implementation of anatomical network visualisations #140
- Add nilearn plotting functionality to scona #145
- Add enhancements to the scona #151
Short description of figures
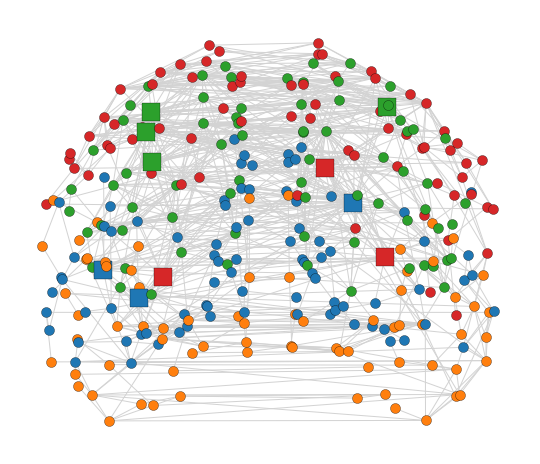
In the top-left, picture you can see the figure of anatomical network layout in the coronal orientation. The color of each node is chosen based on the “module” measure. Additionally, rich club nodes are shown as a rectangular to distinguish themselves from other nodes.
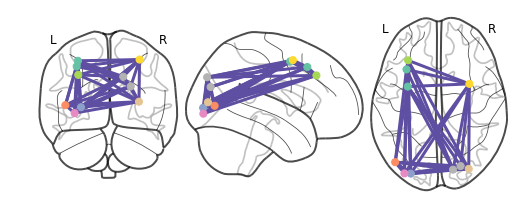
In the bottom-left picture, the brain connectome is plotted. Rich-club nodes and connections between them are displayed.
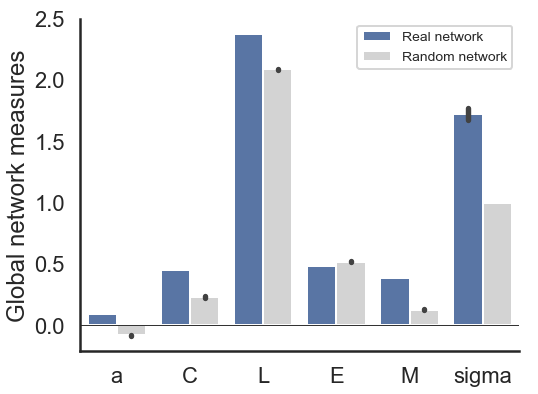
In the top-right figure, global measures of the network are shown compared to the values of the global measures of randomly generated networks.
These measures are: a: assortativity, C: clustering coefficient, L: shortest path, E: efficiency, M: modularity, σ: small world coefficient.
You can read more on the measures here.
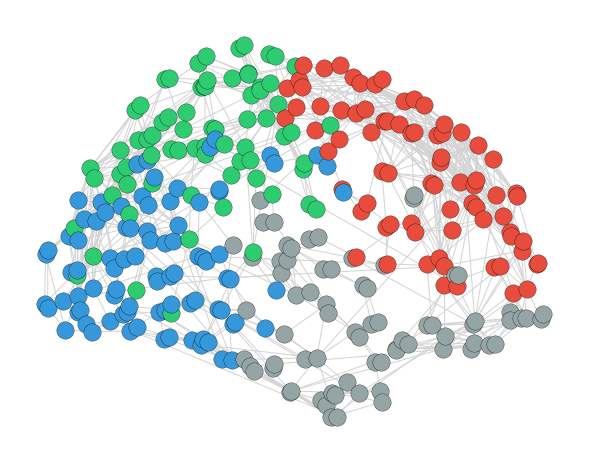
In the bottom-right, you can see the figure of anatomical network layout in the sagittal orientation with the custom colors for each “module” measure.
Run tutorials right away
Moreover, anyone can easily reproduce the code in the scona tutorials anywhere by using binder.
Simply follow the links below and you will be able to interact with the selected tutorial (jupyter notebook) in a live environment!
scona is openly available software to allow all neuroscience researchers to conduct reproducible and biologically meaningful investigations of the human brain.
Feel free to chat with the community and try the package yourself in Binder.
Challenges
Of course, there were some challenges during my project.
To name a few: writing understandable tutorials, adjusting parameters to ensure the produced figures are ready to be published in the research paper and … colorbars (do not underestimate them!).
Probably the hardest thing was to write clear tutorials to demonstrate the usage of the scona package for data visualisation.
Together with the supportive community, we managed to accomplish the task.
Moreover, owing to the constant feedback from my mentor, I was able to develop visualisation functions that produce publication-ready plots, thereby achieving my goal in this project.
Wish I could do more
Now, when I became comfortable with the project, I feel like I could have contributed more to the development of the command-line tool itself if I initially had more knowledge in the neuroscience field. Nevertheless, Kirstie managed to explain the gist of the major concepts and ideas to newbies like me, which allowed me to write documentation and to improve the code for conducting brain analysis, i.e. to improve the performance of small-world coefficient calculations.
What I learned
Besides improving my technical skills, I’ve learned much more about the open-source world of software development. There are a lot of enthusiastic and top-notch contributors who support different open-source initiatives by devoting their time and efforts to build projects that make people’s lives better and easier.
What is more, I was able to acquire a great understanding about open science principles and reproducibility in science from my mentor. Dr Kirstie Whitaker addresses the flaws in the academic world by advocating for reproducible & replicable research and promoting a true ideal for open science that supports diversity and inclusion.
Thanks
Many thanks to my mentor Dr Kirstie Whitaker and to Isla Staden, who were always very helpful and responsive.